Learning Path
Graphs Learning Path
By Aoife McDonnell
A range of resources tackling graph concepts such as best fit, line graph, bar chart and graphing stories. Resources have cross curricular ability within science, physics and mathematics in particular.
3 resources in this Learning Path
1
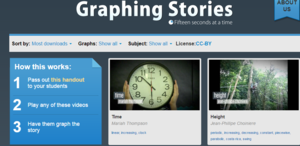
Graphing Stories
http://graphingstories.com/ Added: 10 Jun 2016 Contributor: Scoilnet Resource type: Guide/notes / Audio / VideoGraphing Stories allows students to think about variables in a graph along with creativity designing graphs with their own meaning thereby analysing the function of using graph skills to represent a story.
View full descriptionHow it maps to the curriculum
- JC
- Science
Strand: 1. Nature of Science
Strand unit: 4. Analyse Data & Jusify Conclusions
Suggestions for use: Print out the handout and pass out one to each student. Advice students to use pencil. Play any video from the website. Students graph the data to represent a story.
Key Skills: Communicating Managing Information and Thinking Working with Others
2
Creating Graphs Using Excel
https://www.scoilnet.ieuploads/resources/14831/14470.pdf Added: 22 Jul 2015 Contributor: Carmel Burns Resource type: Demonstration / Guide/notes / Lesson PlanTeach children how to use spreadsheets for data collection and data analysis. Create graphs and charts to represent data.
View full descriptionHow it maps to the curriculum
- 5-6
- Mathematics
Strand: Data & Chance
Strand unit: Representing and interpreting data
Content objective: This resource should enable a child to:
- collect, organise and represent data using pictograms, single and multiple bar charts and simple pie charts
- collect, organise and represent data using pie charts and trend graphs
- compile and use simple data sets
- read and interpret pictograms, single and multiple bar charts, and pie charts
- read and interpret trend graphs and pie charts
- use data sets to solve problems
3
Maths is Fun - Make your own Graph
http://www.mathsisfun.com/data/graphs-index.html Added: 02 Jul 2015 Contributor: Niamh Sheehan Resource type: ToolSimple tools for creating graphs
View full descriptionHow it maps to the curriculum
- 3-4
- Mathematics
Strand: Data & Chance
Strand unit: Representing and interpreting data
Content objective: This resource should enable a child to:
- collect, organise and represent data using pictograms, block graphs and bar charts
- collect, organise and represent data using pictograms, block graphs, bar charts and bar-line graphs incorporating the scales 1:2, 1:5, 1:10, and 1:100
- read and interpret bar-line graphs and simple pie charts
- read and interpret tables, pictograms, block graphs and bar charts
Suggestions for use: A tool for creating simple graphs and charts at all class levels.